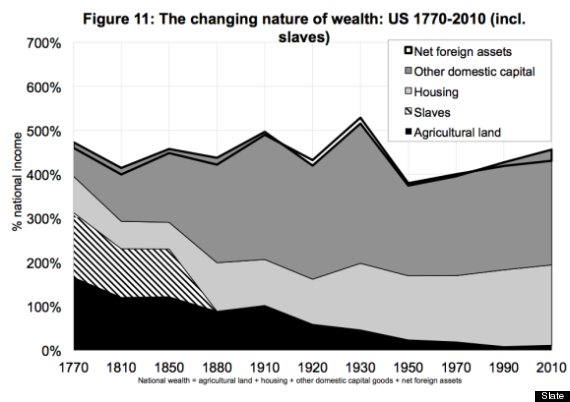
Thomas Piketty and Gabriel Zucman have a new paper out (PDF) about the historical evolution of wealth in a number of different prominent countries, and it features this chart for the United States that really drives home the amazing reality of America's antebellum slave economy. The "human capital" consisting of black men and women held as chattel in the states of the south was more valuable than all the industrial and transportation capital ("other domestic capital") of the country in the first half of the nineteenth century. When you consider that the institution of slavery was limited to specific subset of the country, you can see that in the region where it held sway slave wealth was wealth.
In their discussion, the point Piketty and Zucman make about this is that slave wealth was the functional equivalent of land wealth in a country where agricultural land was abundant. The typical European wealth-holding pattern was of an economic elite composed of wealthy landowners in a environment of scarce usable land. In America, land was plentiful since you could steal it from Native Americans. That should could have led to an egalitarian distribution of wealth, but instead an alternative agrarian elite emerged that did happen to own large stocks of land but whose wealthy was primarily composed of owning the human beings who worked the land rather than owning the land itself.
9 Ways People Have Not Recovered:
Meanwhile, corporate profits are still booming.
In their discussion, the point Piketty and Zucman make about this is that slave wealth was the functional equivalent of land wealth in a country where agricultural land was abundant. The typical European wealth-holding pattern was of an economic elite composed of wealthy landowners in a environment of scarce usable land. In America, land was plentiful since you could steal it from Native Americans. That should could have led to an egalitarian distribution of wealth, but instead an alternative agrarian elite emerged that did happen to own large stocks of land but whose wealthy was primarily composed of owning the human beings who worked the land rather than owning the land itself.
9 Ways People Have Not Recovered:
- Unemployment
- Income And Wages
Meanwhile, corporate profits are still booming.
- Number Of People On Food Stamps
- Uninsured Americans
- Student Loan Debt
- Homelessness
- Children In Poverty
- Homeownership
- Foreclosures

No comments:
Post a Comment