Just because the government doesn't define you as poor, doesn't mean you have enough money to live.
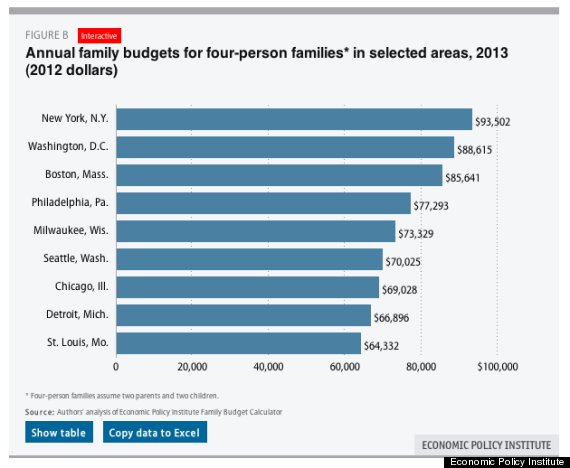
The federal poverty line for a family of four was $23,283 last year, nearly one-quarter of what it takes to live in New York City and slightly more than one-third of what it takes to live in St. Louis, according a family budget calculator from the Economic Policy Institute, a left-leaning think tank. In fact, EPI found that in 615 cities across the country it takes a total income at least twice the federal poverty line for any type of family with three children or fewer to afford basic expenses.
“I don’t think anyone gets any sense of economic security from living at that line,” Elise Gould, one of the paper’s authors and the director of health policy research at EPI, told The Huffington Post. “It’s a measure of absolute deprivation.”
(Click over to EPI's budget calculator to determine how much it costs for a family to live in your city.)
In determining the income required for a family to get by, EPI’s budget calculator considers the regional cost of housing, child care, health care, transportation and other basic needs. It illustrates the limits of the Census' official poverty measure, which is determined using the cost of certain food staples nationally and adjusts with inflation.
The government launched an alternative measure of poverty in recent years, which includes costs like clothing, housing and the income received through tax credits and government benefits. Still, it doesn’t take into account as many variables as EPI’s measure and isn’t as geographically specific.
In order to be able to afford to live anywhere in the country, workers have to be making more than the federal minimum wage of $7.25 an hour, according to EPI. There’s nowhere in America where two parents earning the federal minimum wage, which amounts to about $30,000 per year collectively, can make enough to support a family of three or four, the analysis found.
To put that into perspective, it takes a combined income of $44,617 for a two parent, one child household to cover basic needs in Simpson County, Mississippi, the region with the lowest cost of living for that type of family, according to EPI’s calculator.
That measure doesn’t account for the fact that some states have a minimum wage that's higher than $7.25. Still, about 3.6 million workers earned the federal minimum wage or below last year, according to the Bureau of Labor Statistics.
Raising the minimum wage would help families at least get to EPI’s level of basic economic security, but as Gould notes, the measure still only allows enough money for a family living very basically and essentially paycheck-to-paycheck.
“None of those things which would put people more solidly in the middle class are in our budget,” she said. “This is definitely a modest budget even though it is so much higher the federal poverty line.”
Check out this chart from EPI, which shows how much money it takes for a family of four to live in various cities:
9 Ways To See With Your Own Eyes That Americans Haven't Recovered:
Unemployment:
When the economy was roaring in 2007, the U.S. unemployment rate was 5 percent. In January 2013 the unemployment rate was 7.9 percent.
Income And Wages:
The U.S. median income fell to $50,054 in 2011, which is the most recent full year in which that data is available. That's down 8.1 percent since 2007. Wages also fell to a record-low 43.5 percent of the economy in 2012, according to the New York Times.
Meanwhile, corporate profits are still booming.
Number Of People On Food Stamps:
The number of Americans on food stamps surged to a record in 46 million in June 2012. That's compared to 26.5 million in 2007.
Uninsured Americans:
More than 16 percent of Americans -- or 48.6 million people -- were uninsured in 2011, according to Kaiser Health News. This number is higher than what it was in 2007, when the share of uninsured Americans was 15.3 percent.
Student Loan Debt:
The average student loan debt for a class of 2011 graduate was about $26,500, according to the Project on Student Debt data cited by the New York Times. Since 2007, when the average student debt was $23,349, student loan debt has increased for almost every demographic and the size of that debt has gone up as well, according to Pew.
Homelessness:
In 2011, 644,067 Americans experienced homelessness on any given night, according to data from the National Alliance to End Homelessness cited by NBC News. Though that number is actually down 13 percent from 2007, the decrease is largely attributed to a boost in the number of programs to help keep the homeless off the streets.
Children In Poverty:
More than 16 million children -- or about 20 percent of American children -- were in poverty in 2011, according to the Census Bureau. That's up from nearly 18 percent of American children in 2007.
Homeownership:
We're on our way to becoming a renter nation. The homeownership rate in the 12 months leading up to May 2012 was 65.4 percent, according to Census Bureau data cited by CNNMoney. That's the lowest rate in 15 years. In the last quarter of 2007, the homeownership rate was 67.8 percent.
Foreclosures:
There were 2.7 million foreclosures in 2011. That's up from 2.2 million foreclosures in 2007.

No comments:
Post a Comment